T-Pot is an open-source honeypot solution developed by Telekom Security. It supports 20+ honeypots and uses the Elastic Stack to visualize the data collected. I’ve collected about 3 weeks worth of historical data and activity logs which should be sufficient for a review.
In regards to the setup, I hosted T-Pot on the cloud using Vultr with the server location set to London. Ubuntu 24.04 LTS was the chosen OS, and had 4 vCPUs, 8 GB memory, 6 TB bandwidth, 180 GB NVMe storage, and the hostname srv-data01.
If you don’t already know what a honeypot is, it is a decoy system or server designed to attract attackers and study their TTPs (tactics, techniques, procedures). Honeypots can be classified by the level of interactivity provided to adversaries, this includes low-interaction, medium-interaction, and high-interaction. They can also be deployed internally (inside a LAN) or externally (exposed to the internet), in our case, the honeypot is deployed externally.
T-Pot is designed to be low maintenance and can be considered a medium-interaction honeypot. Although it has been deployed for a shorter period (~3 weeks), it can still collect detailed attack patterns and signatures.
Remote Access and Tools
Once T-Pot is up and running, the landing page can be accessed via https://<your.ip>:64297 which provides access to the honeypot data along with a couple of other tools.
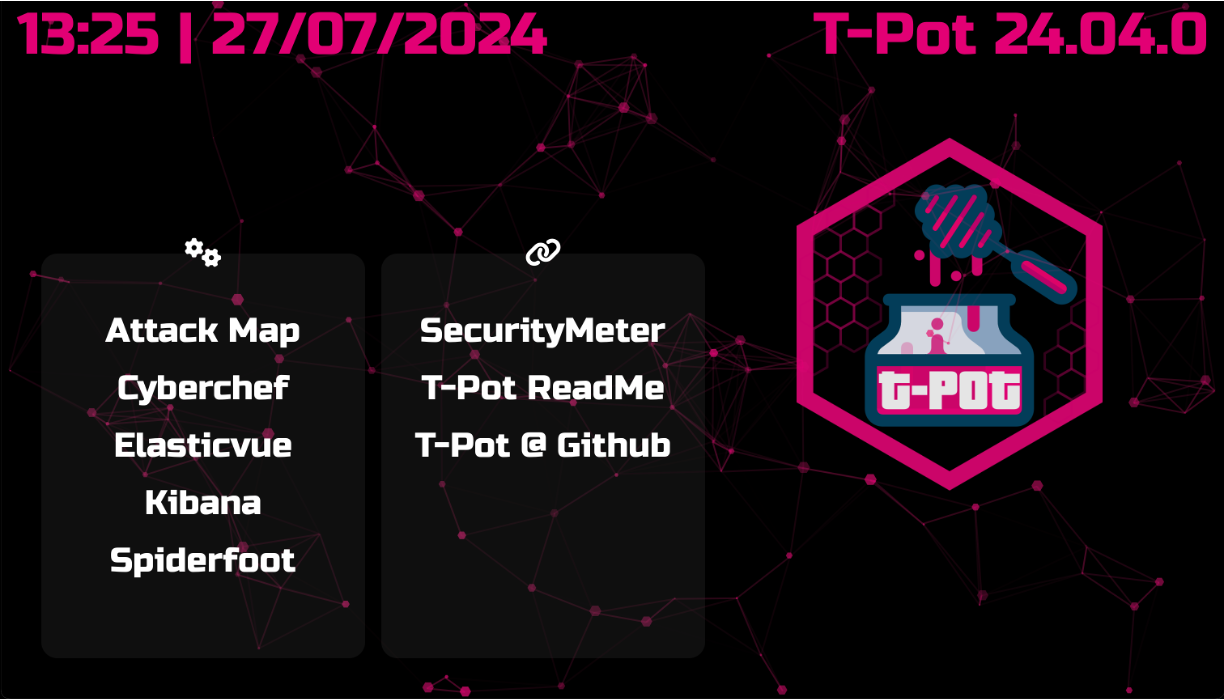
Since the logs from the honeypots are forwarded to Elasticsearch and displayed in Kibana, our main focus will be on Kibana as that is where the bulk of the honeypot data is available for analysis.
Analyzing the Data
Kibana Dashboard
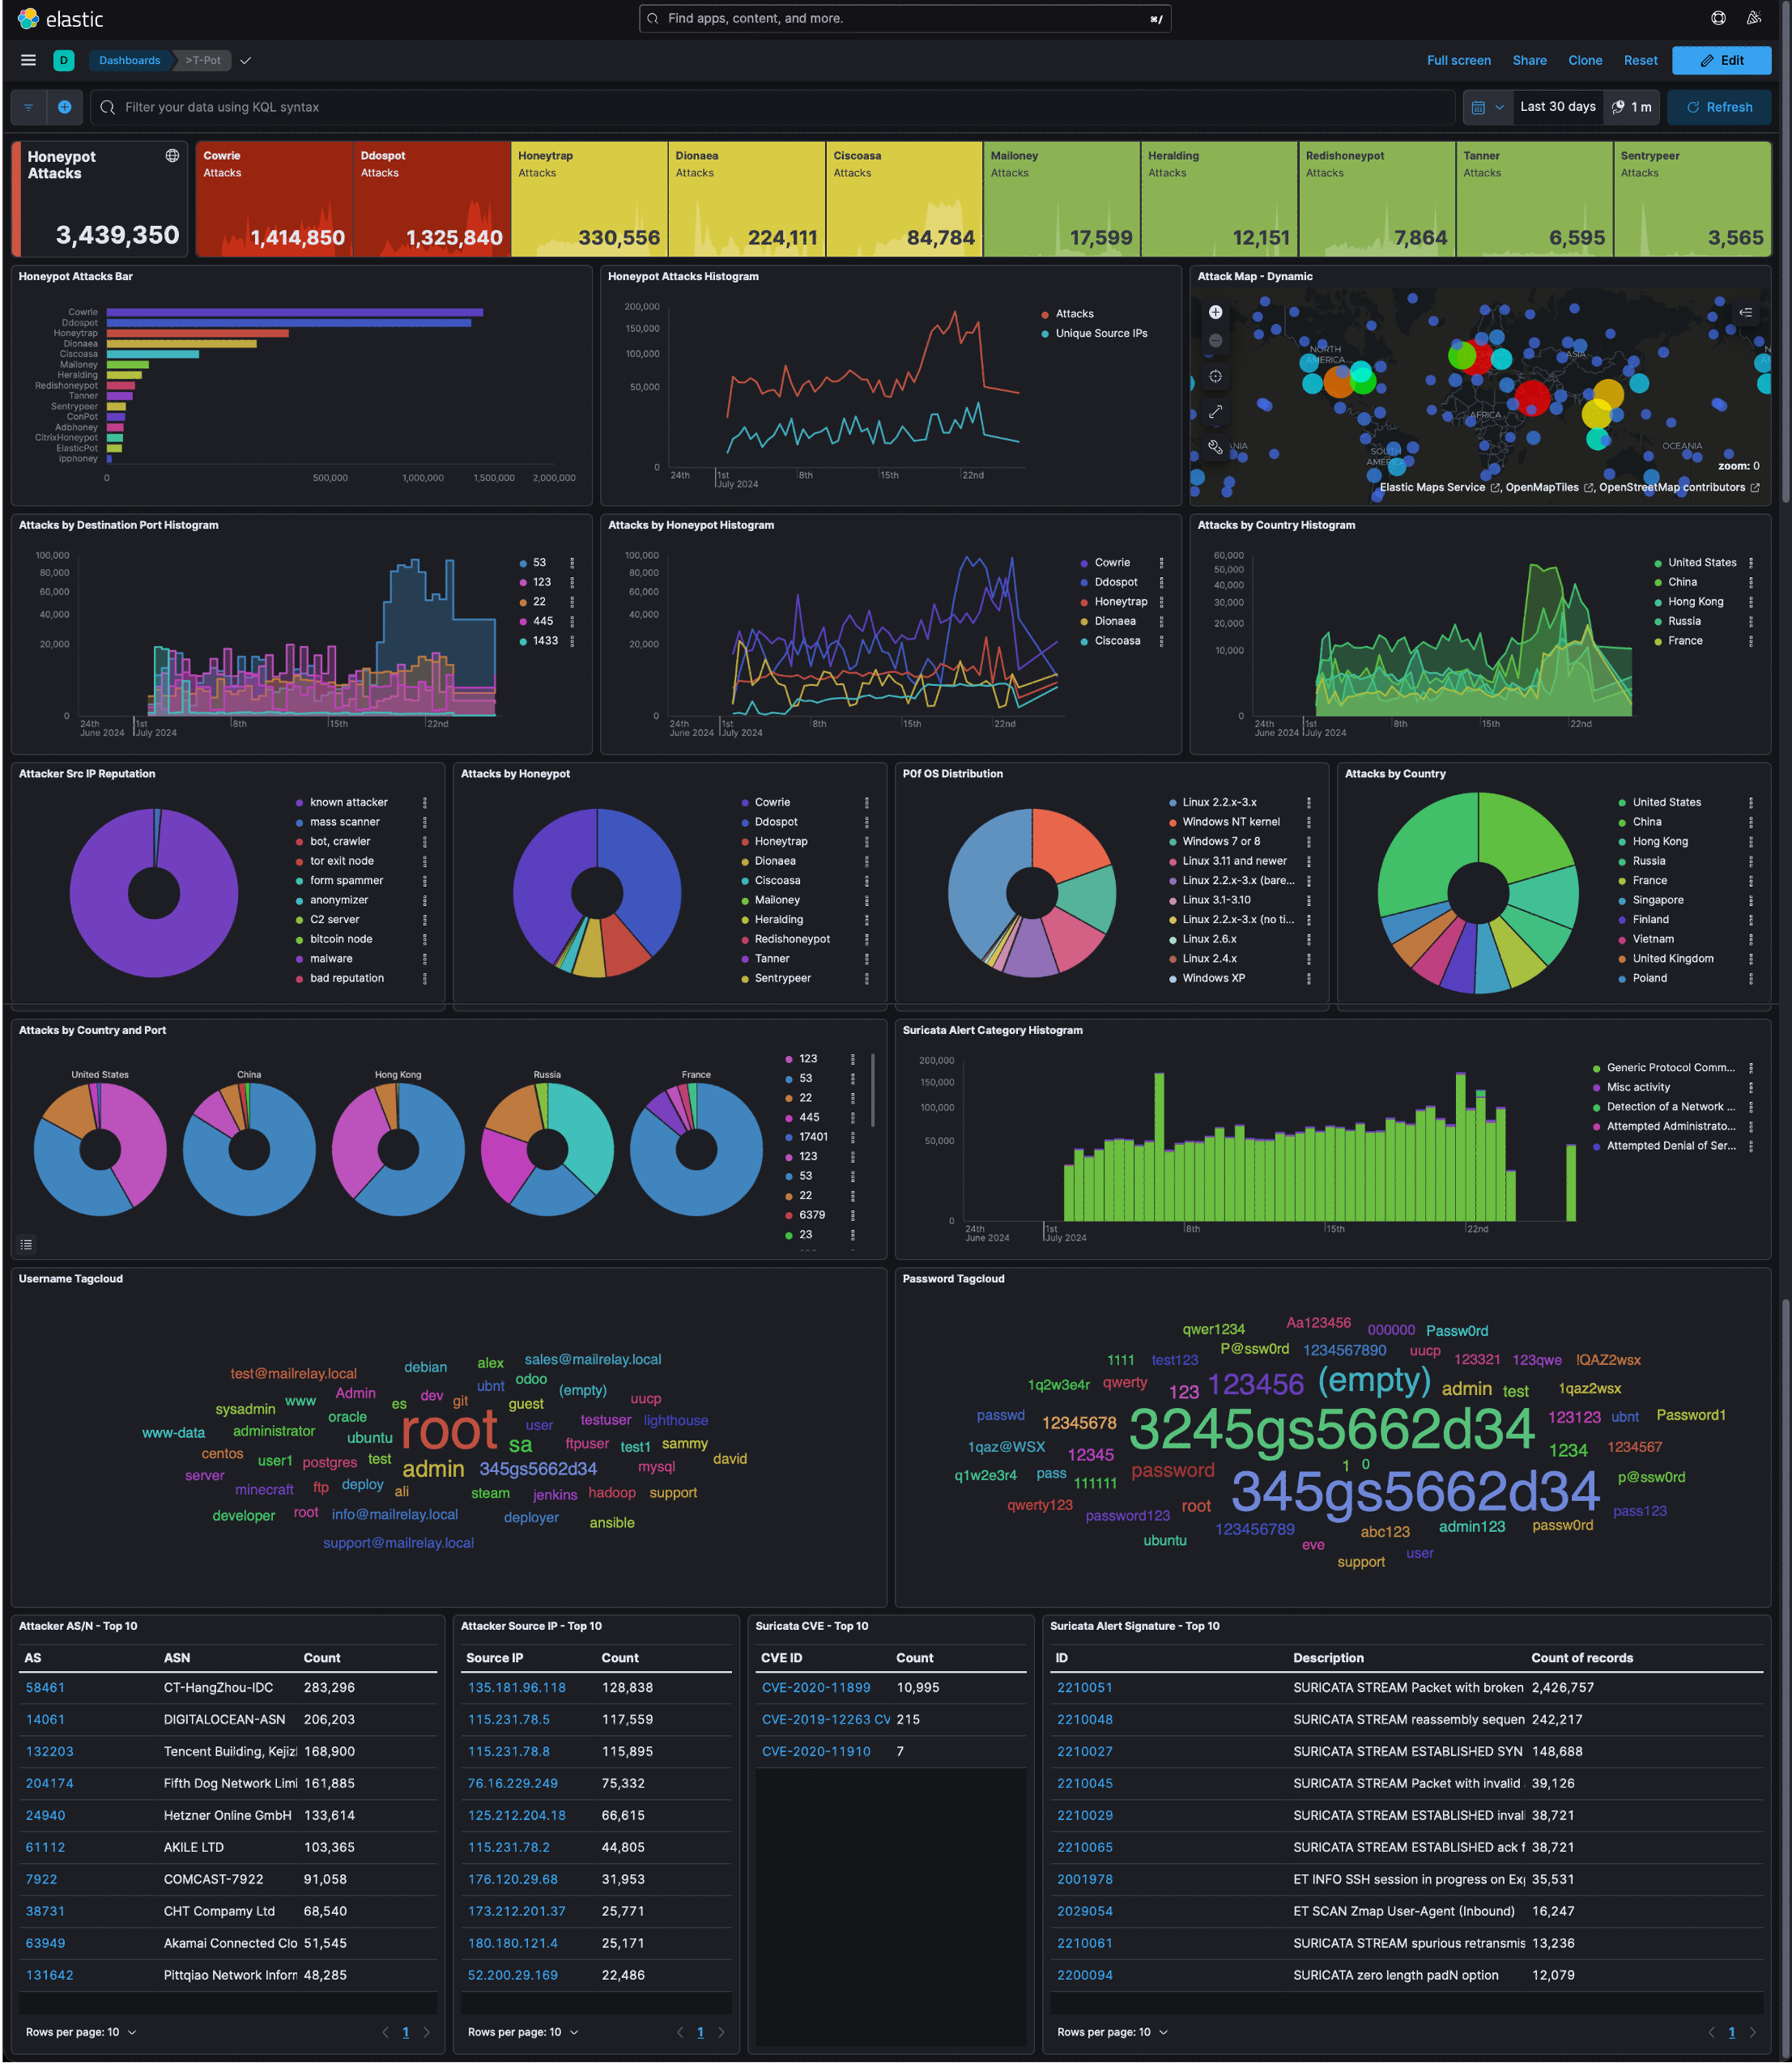
The above screenshot is the Kibana dashboard for the main T-Pot honeypot dashboard. In the 23~ days T-Pot was running for, approximately 3,450,000 attacks were collected. There’s a lot to unpack here, some of the key findings:
- Cowrie and Ddospot were the top two most targeted honeypots, accounting for more than three-quarters of the total attacks.
- The top five countries from which attacks originated were the United States, China, Hong Kong, Russia, and France.
- Examining the Honeypot Attacks Histogram and the Attacks by Honeypot Histogram, we can see that the spikes in the data are primarily attributable to DDoS attacks.
- The top ports accessed were 123 (NTP), 22 (SSH), 445 (SMB over IP), 1433 (MSSQL).
- The data also reveals the top Attackers’ ASN and Source IP. Additionally, it shows the credentials used in access attempts which we will investigate further when discussing Cowrie.
We can look into the reputation of the source IPs involved in these attacks:

The T-Pot dashboard also shows Suricata (IDS) results, giving us a look at indicators of compromise (IoCs) through the top detected CVEs and alert signatures.
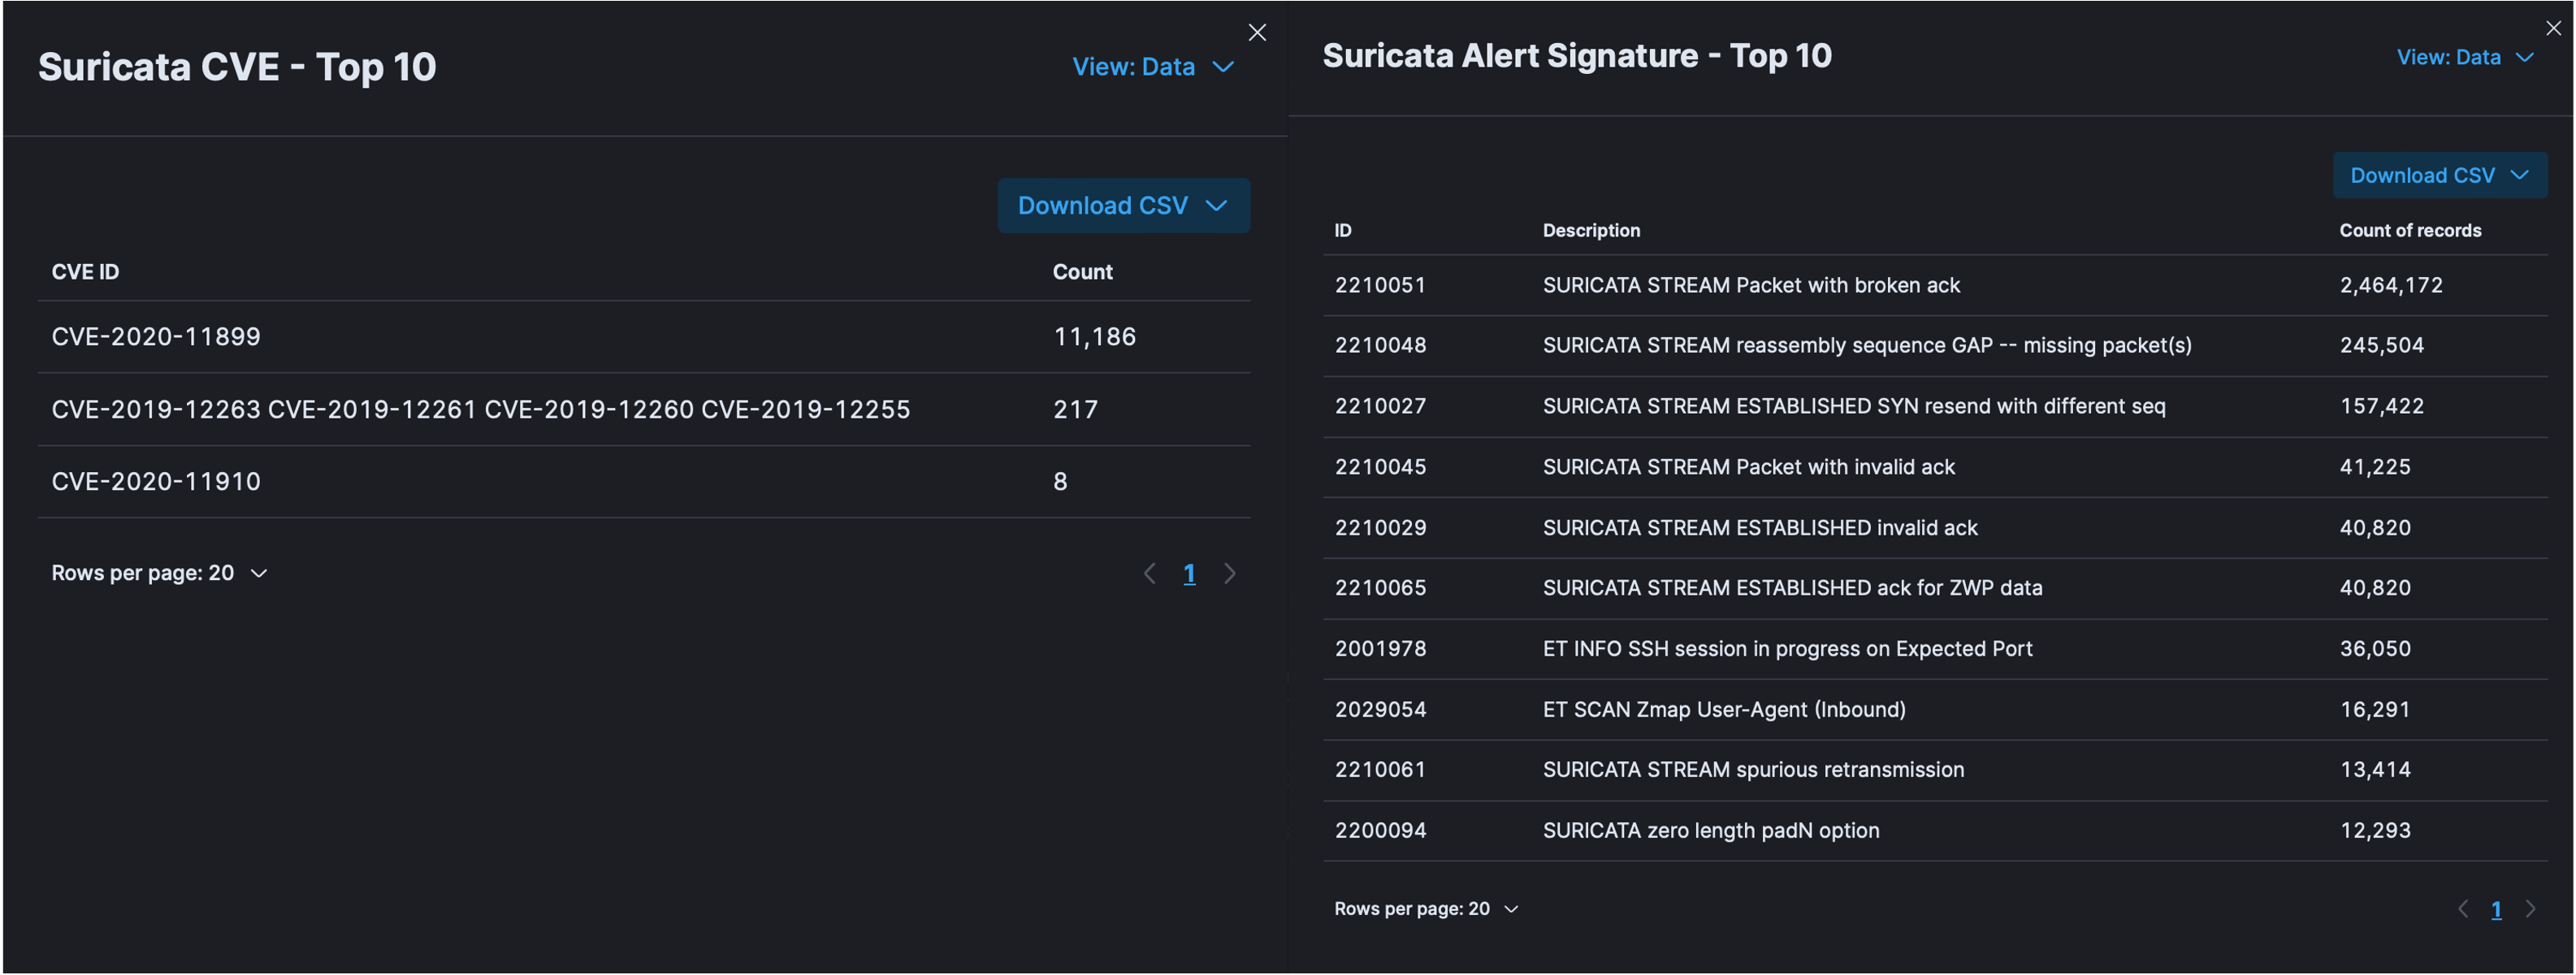
Each signature corresponds to a particular type of attack pattern that Suricata is designed to detect.
Cowrie
While the previous data gives us a good overall picture, the data collected by the Cowrie honeypot will allow us to better understand specific threats and attacker behavior.
Cowrie is an SSH/Telnet honeypot which logs brute force attacks and shell interaction performed by the attacker.
Below, we can see the ports targeted in relation to the countries the attacks originate from.
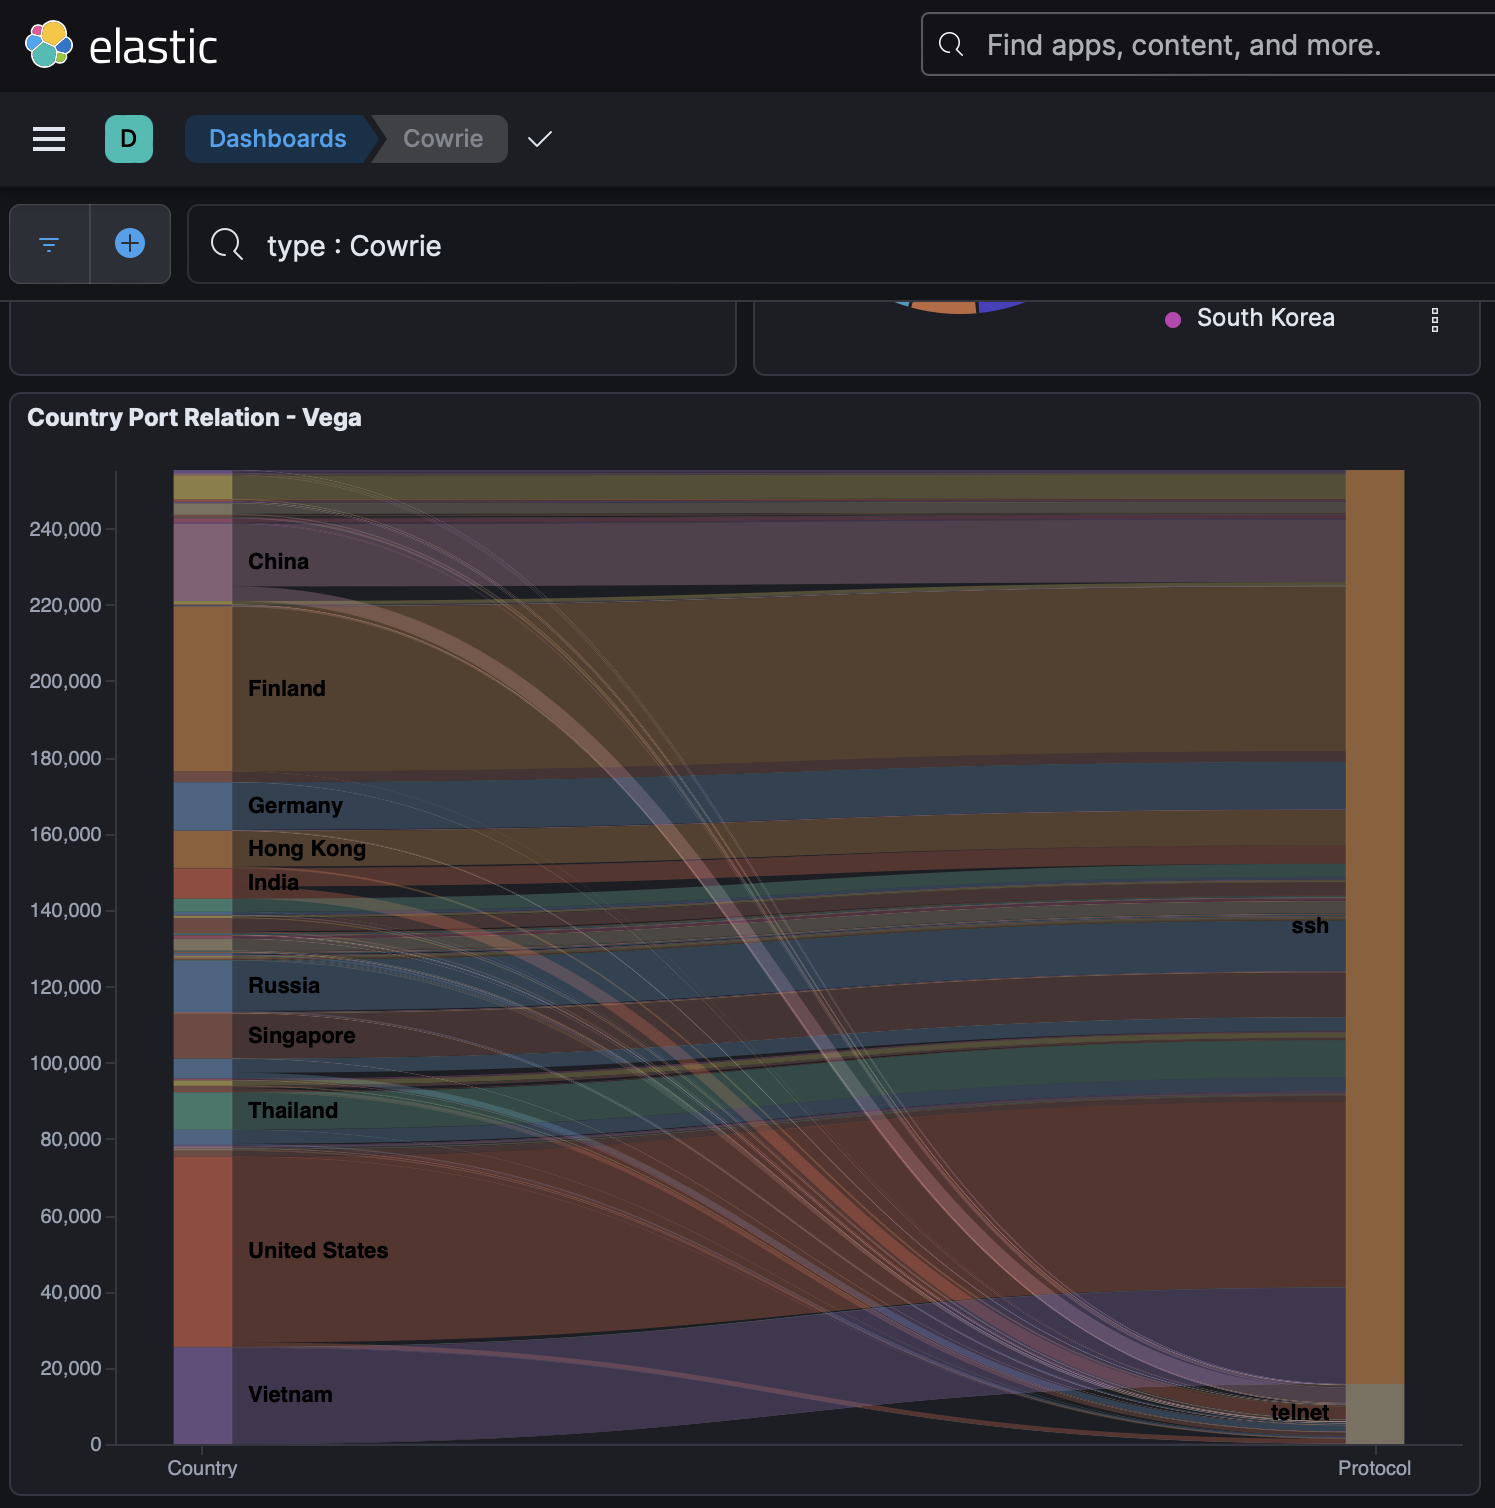
Clearly SSH is the more commonly targeted service with significantly more attacks compared to Telnet (which accounts for just 6.2% of the attacks). While Telnet is old and inherently vulnerable, it is still widely used by some legacy systems which explains why it is still a point of interest for attackers.
We can also look at the credentials used to access the honeypot:

Frequently attempted usernames include ones like admin, root, and server, with passwords used such as admin, password, and root. These are being used commonly used due to their prevalence in default accounts with default or weak passwords.
However, we also see the combination of 3245gs5662d34 and 345gs5662d34 commonly being used as passwords. These passwords initially seemed very random, but I later discovered that similar cases have been observed on many other honeypots. Since they don’t correspond to any known attack vectors, the best guess is that this might be a honeypot detection strategy.
Moving on, once the attackers obtain a shell on the system, all their command line inputs are logged:
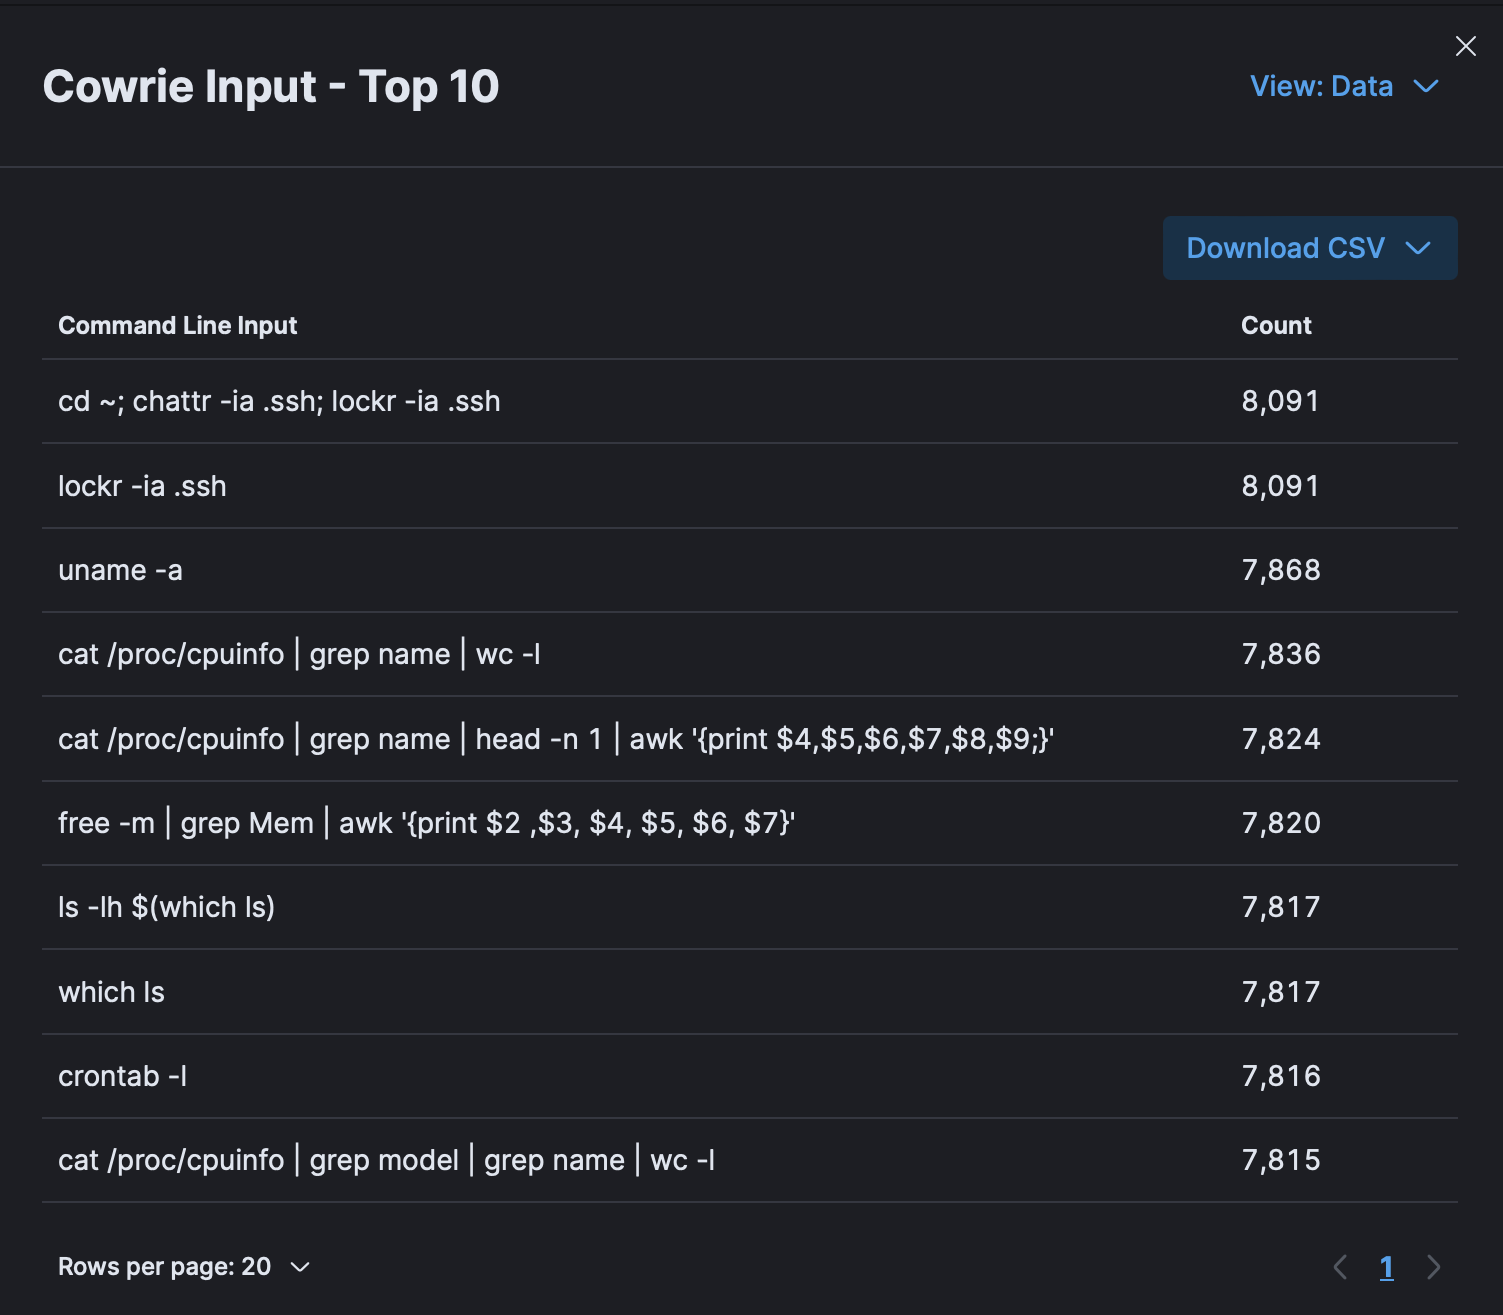
Generally, the commands show attempts to gather system information and modify configurations. This would help attackers maintain access and decide which exploit to launch. Although most of these commands likely come from bots, this information can provide valuable insights about the attackers’ TTPs – whether they are human or automated.
Cowrie also collects the types of files attackers are trying to bring into the system. The most frequently accessed URIs used by attackers to download files are:
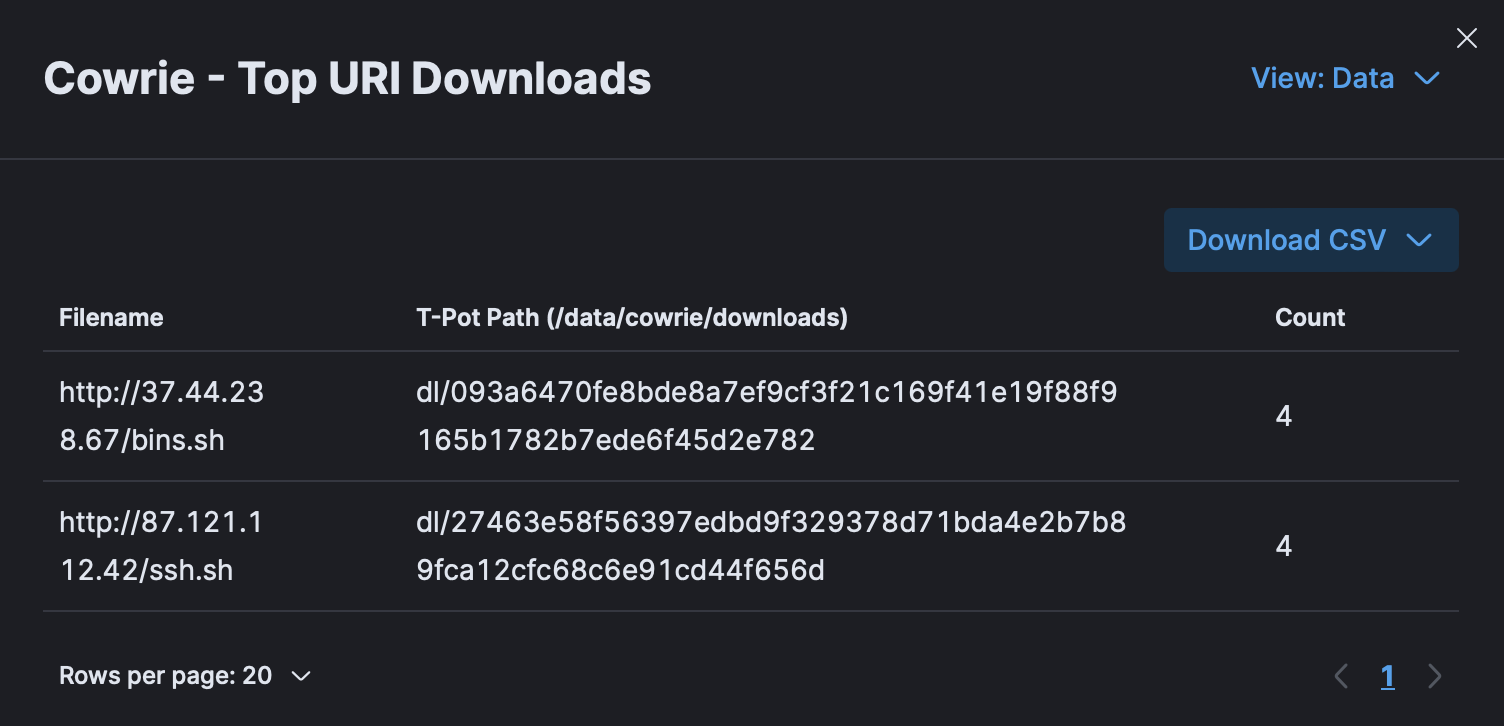
Submitting these to VirusTotal:
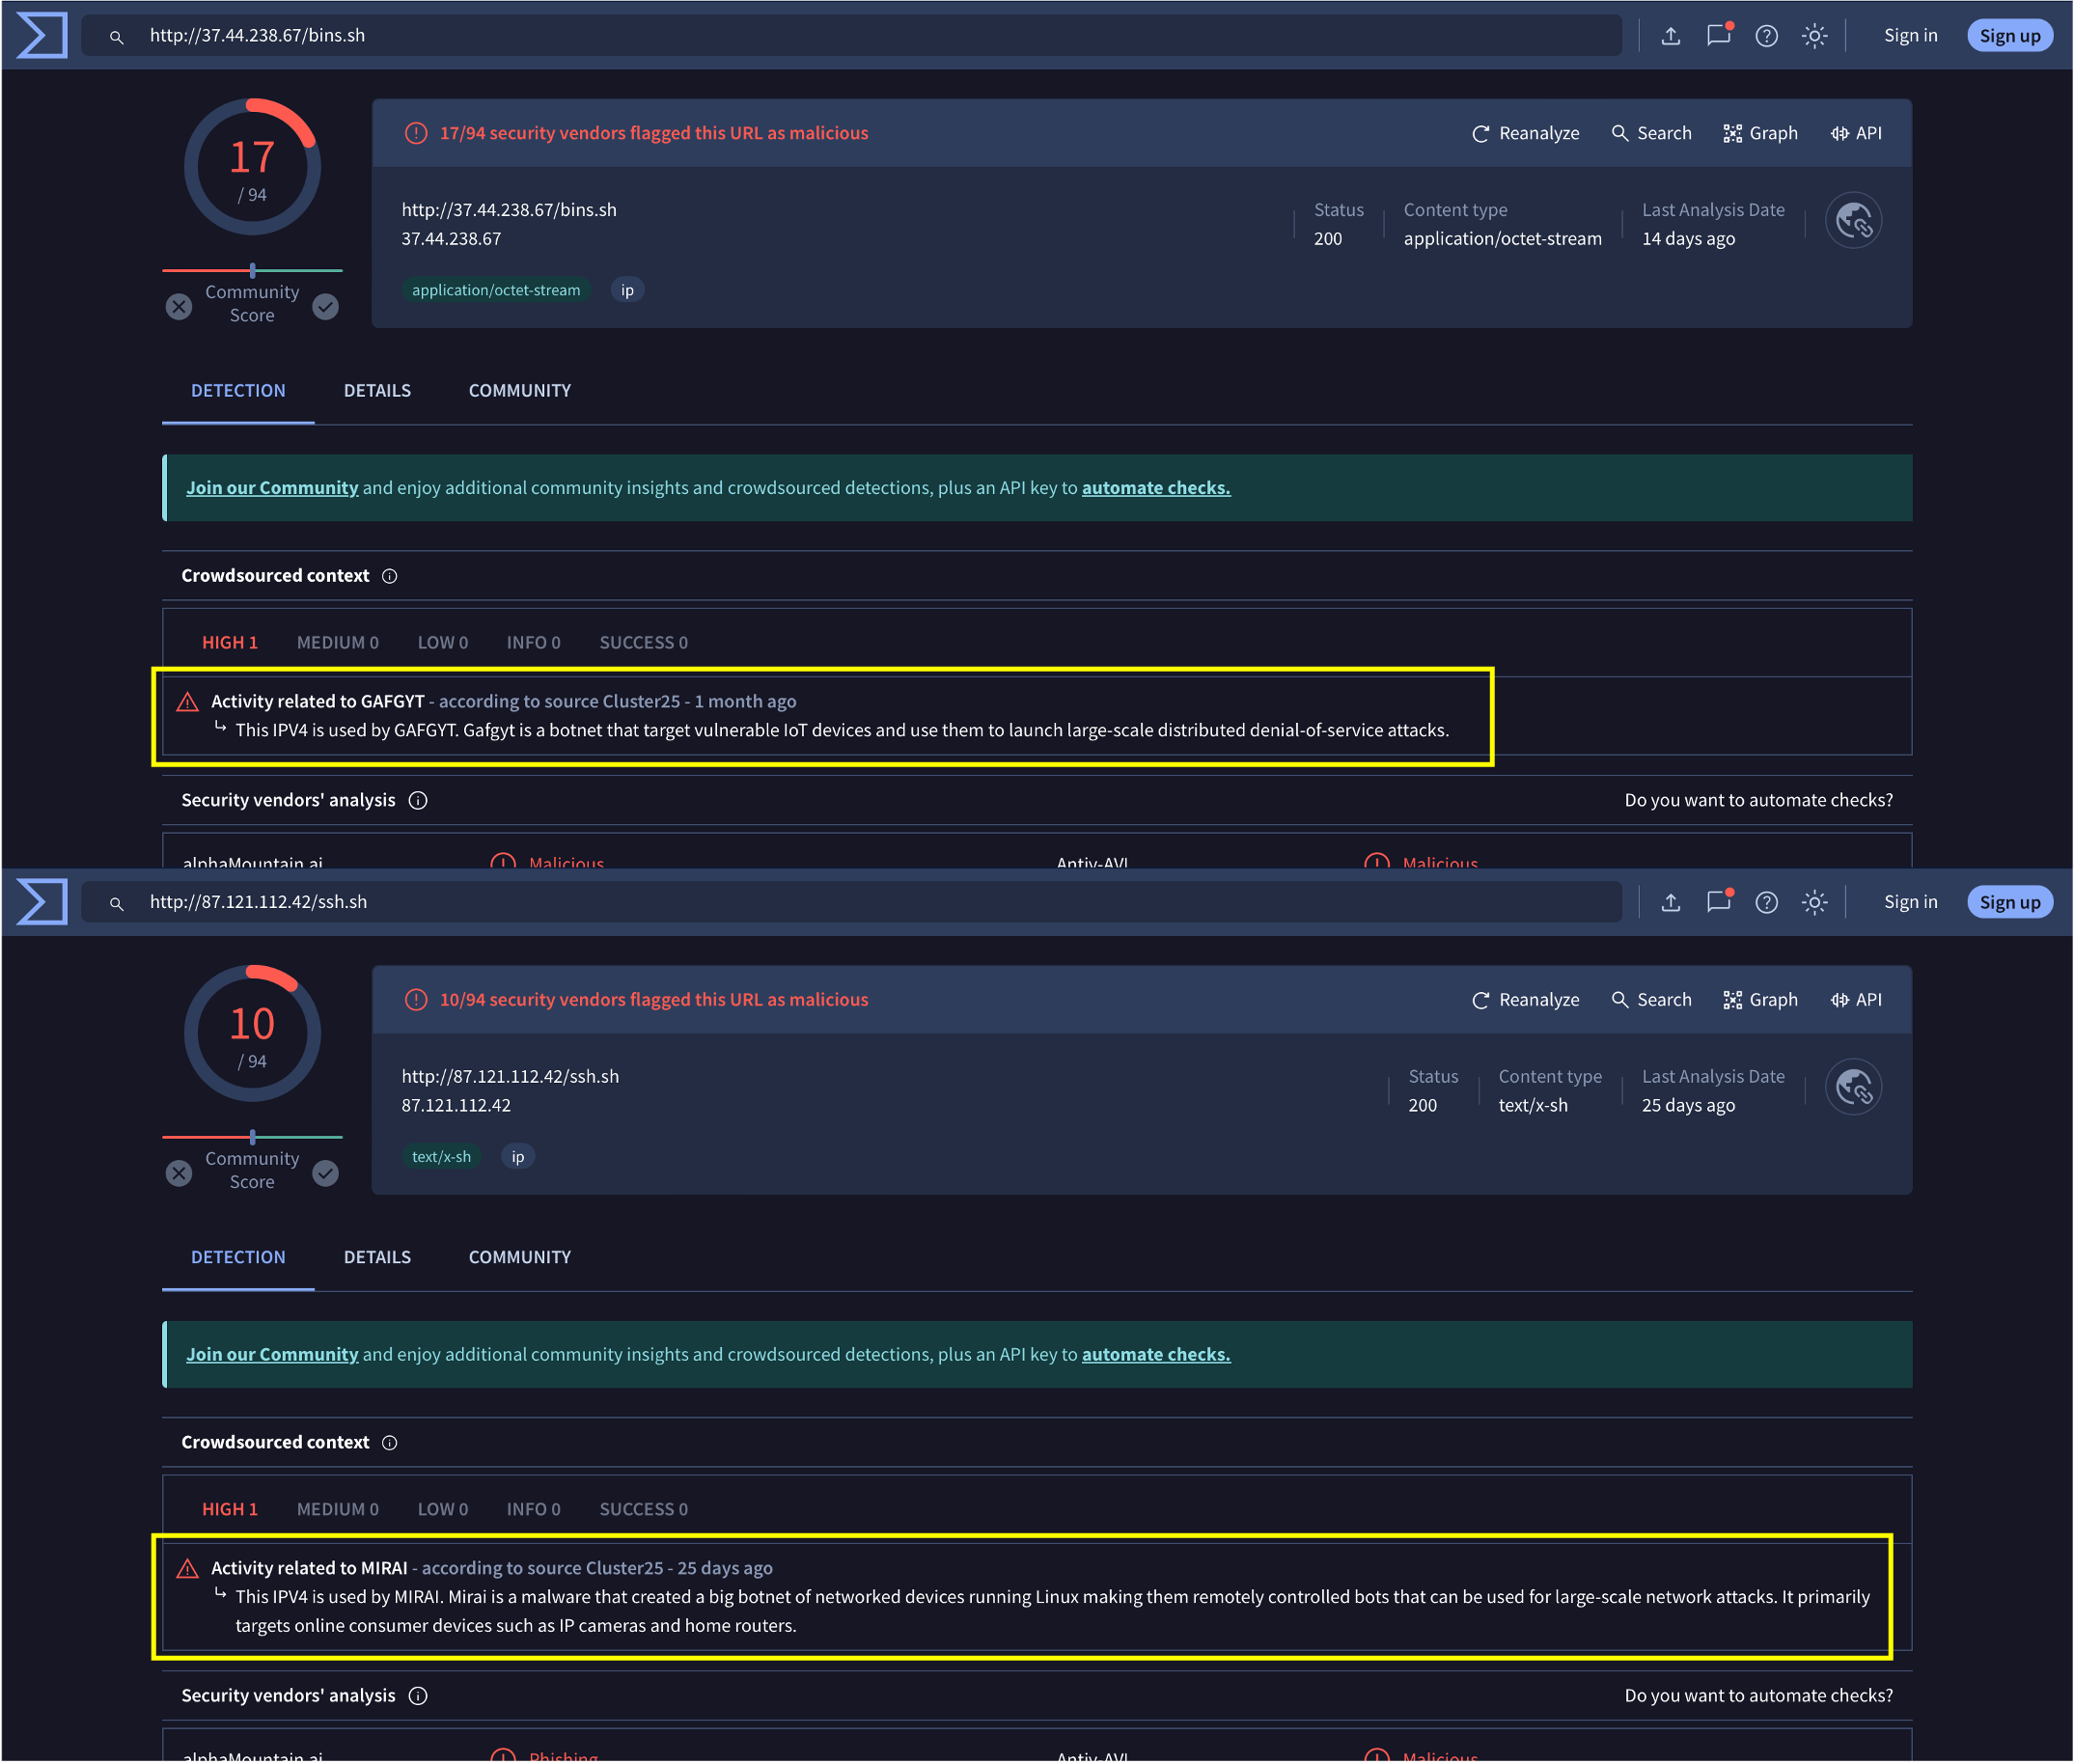
We find that http://37.44.238.67/bins.sh is associated with the GAFGYT (or BASHLITE) malware, and http://87.121.112.42/ssh.sh is associated with the MIRAI botnet. Both pose a serious threat to vulnerable IoT devices.
Cowrie also lists the top downloaded files, regardless of where they were downloaded from:
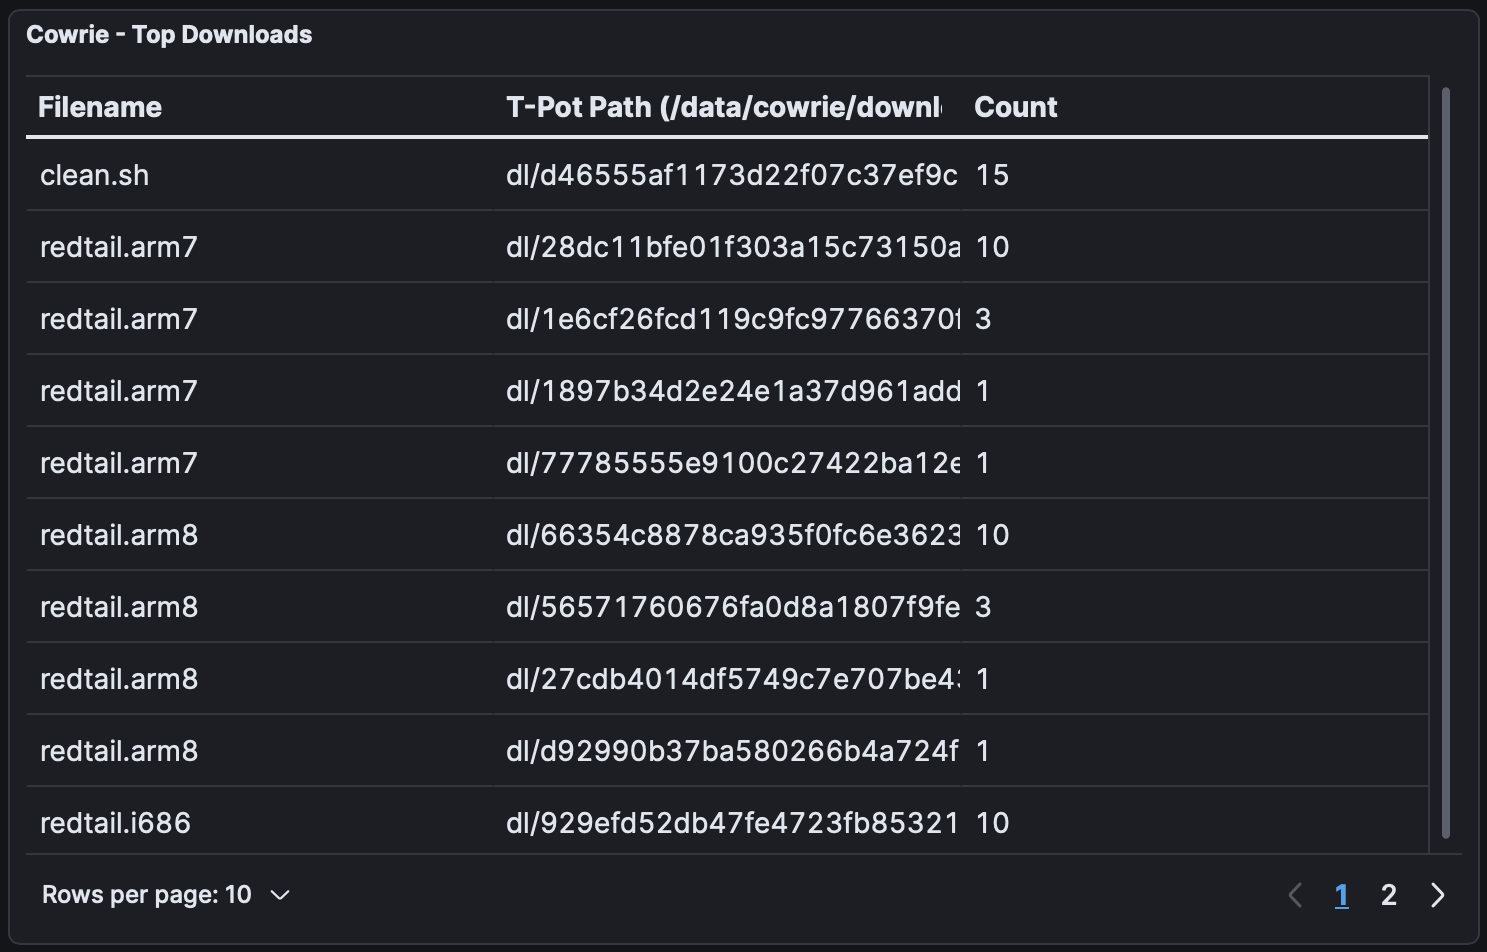
The clean.sh script erases traces of malware by cleaning crontab entries, stopping mining services, and deleting temporary files. In the past, it has been seen used for searching for other coin miners and malware to clean/remove.
The redtail file has been downloaded in various architectures including .arm7, .arm8, .x86_64, .i686 – with further research revealing it to be a cryptomining malware.
Not visible in the image, two other downloads were also observed, sshd (OpenSSH Daemon) and eyshcjdmzg (Linux Trojan - XorDDoS).
Wrapping It Up
There’s still a lot that can be done with the data from the honeypot. This research demonstrates just how sophisticated threat actors have become with their use of automation and botnets. In the future, I hope to run it for a longer period to collect even more actionable data. This could help in discovering any undetected malware samples which I could attempt to reverse engineer. With an extended collection period, we may see even more interesting and valuable data from the other honeypots that T-Pot deploys.
Thank you for reading!